1.4 The need for (calibrated) radars in the Philippines
With over 20 typhoons passing through or near the country annually, there are months when rainy days outnumber dry days. Although people are accustomed to frequent thunderstorms, typhoons, and monsoons, they are still caught by surprise by extreme rainfall events. Tropical Storm Ketsana (locally named as Ondoy) passed through the northern island of Luzon in September 2009, which brought rainfall that exceeded the country’s forty-year meteorological record (Abon, David, and Pellejera 2011). TS Ketsana dumped 350 mm rainfall within six hours, which reached 450 mm after twelve hours in Metropolitan Manila. This unusual amount of rain within a short time period resulted in catastrophic flooding in several cities in the metropolitan area and much of Southern Luzon, leading to an estimated PhP 11 Billion (USD 211 Million) in damages and 464 casualties (Abon, David, and Pellejera 2011).
As a response to the need for better disaster awareness, prevention, and mitigation, a disaster risk reduction program (Project NOAH: Nationwide Operational Assessment of Hazards, Lagmay et al. (2017)) was established in July 2012. Within the framework of this project, radar data was visualized and released to a public domain in (near) real-time, that people can access anytime and anywhere. This newly established platform was put to the test a month later, when Metro Manila and the surrounding areas were struck by sustained torrential rainfall brought by the southwest monsoon, which went on for several days. The southwest monsoon (named after the origin of the winds) is a regular natural weather phenomenon that brings significant rainfall from June to September in the Asian subcontinent, lasting for several days or weeks at a time (Lagmay et al. 2015). At the same time, Typhoon Haikui was passing north of the Philippines, where its southern portion already carrying winds in the northeast direction enhanced the winds of the southwest monsoon. This typhoon pulled in more warm air and precipitation from the West Philippine Sea towards the western coast of the country, which led to the event named as Habagat of August 2012.
This event, coupled with the recent access to the radar data due to Project NOAH, led to a collaboration with the University of Potsdam. Together, we had a first look at the extent of the rainfall distribution in high resolution through the Subic radar, discussed more in detail in Chapter 2 of this thesis. Apart from the key findings of Chapter 2 about the rainfall distribution, we also learned that the Subic radar estimates are highly underestimating by as much as a third of the rain gauge recordings, for reasons unclear to the authors at the time of writing. This was the first time we were confronted with the idea that the Philippine radars might be experiencing calibration issues. Following these developments, the work carried out in Chapters 3 and 4 allowed for further investigation of the radar biases. With more years of data, a study on the calibration of the Philippine radars can be conducted.
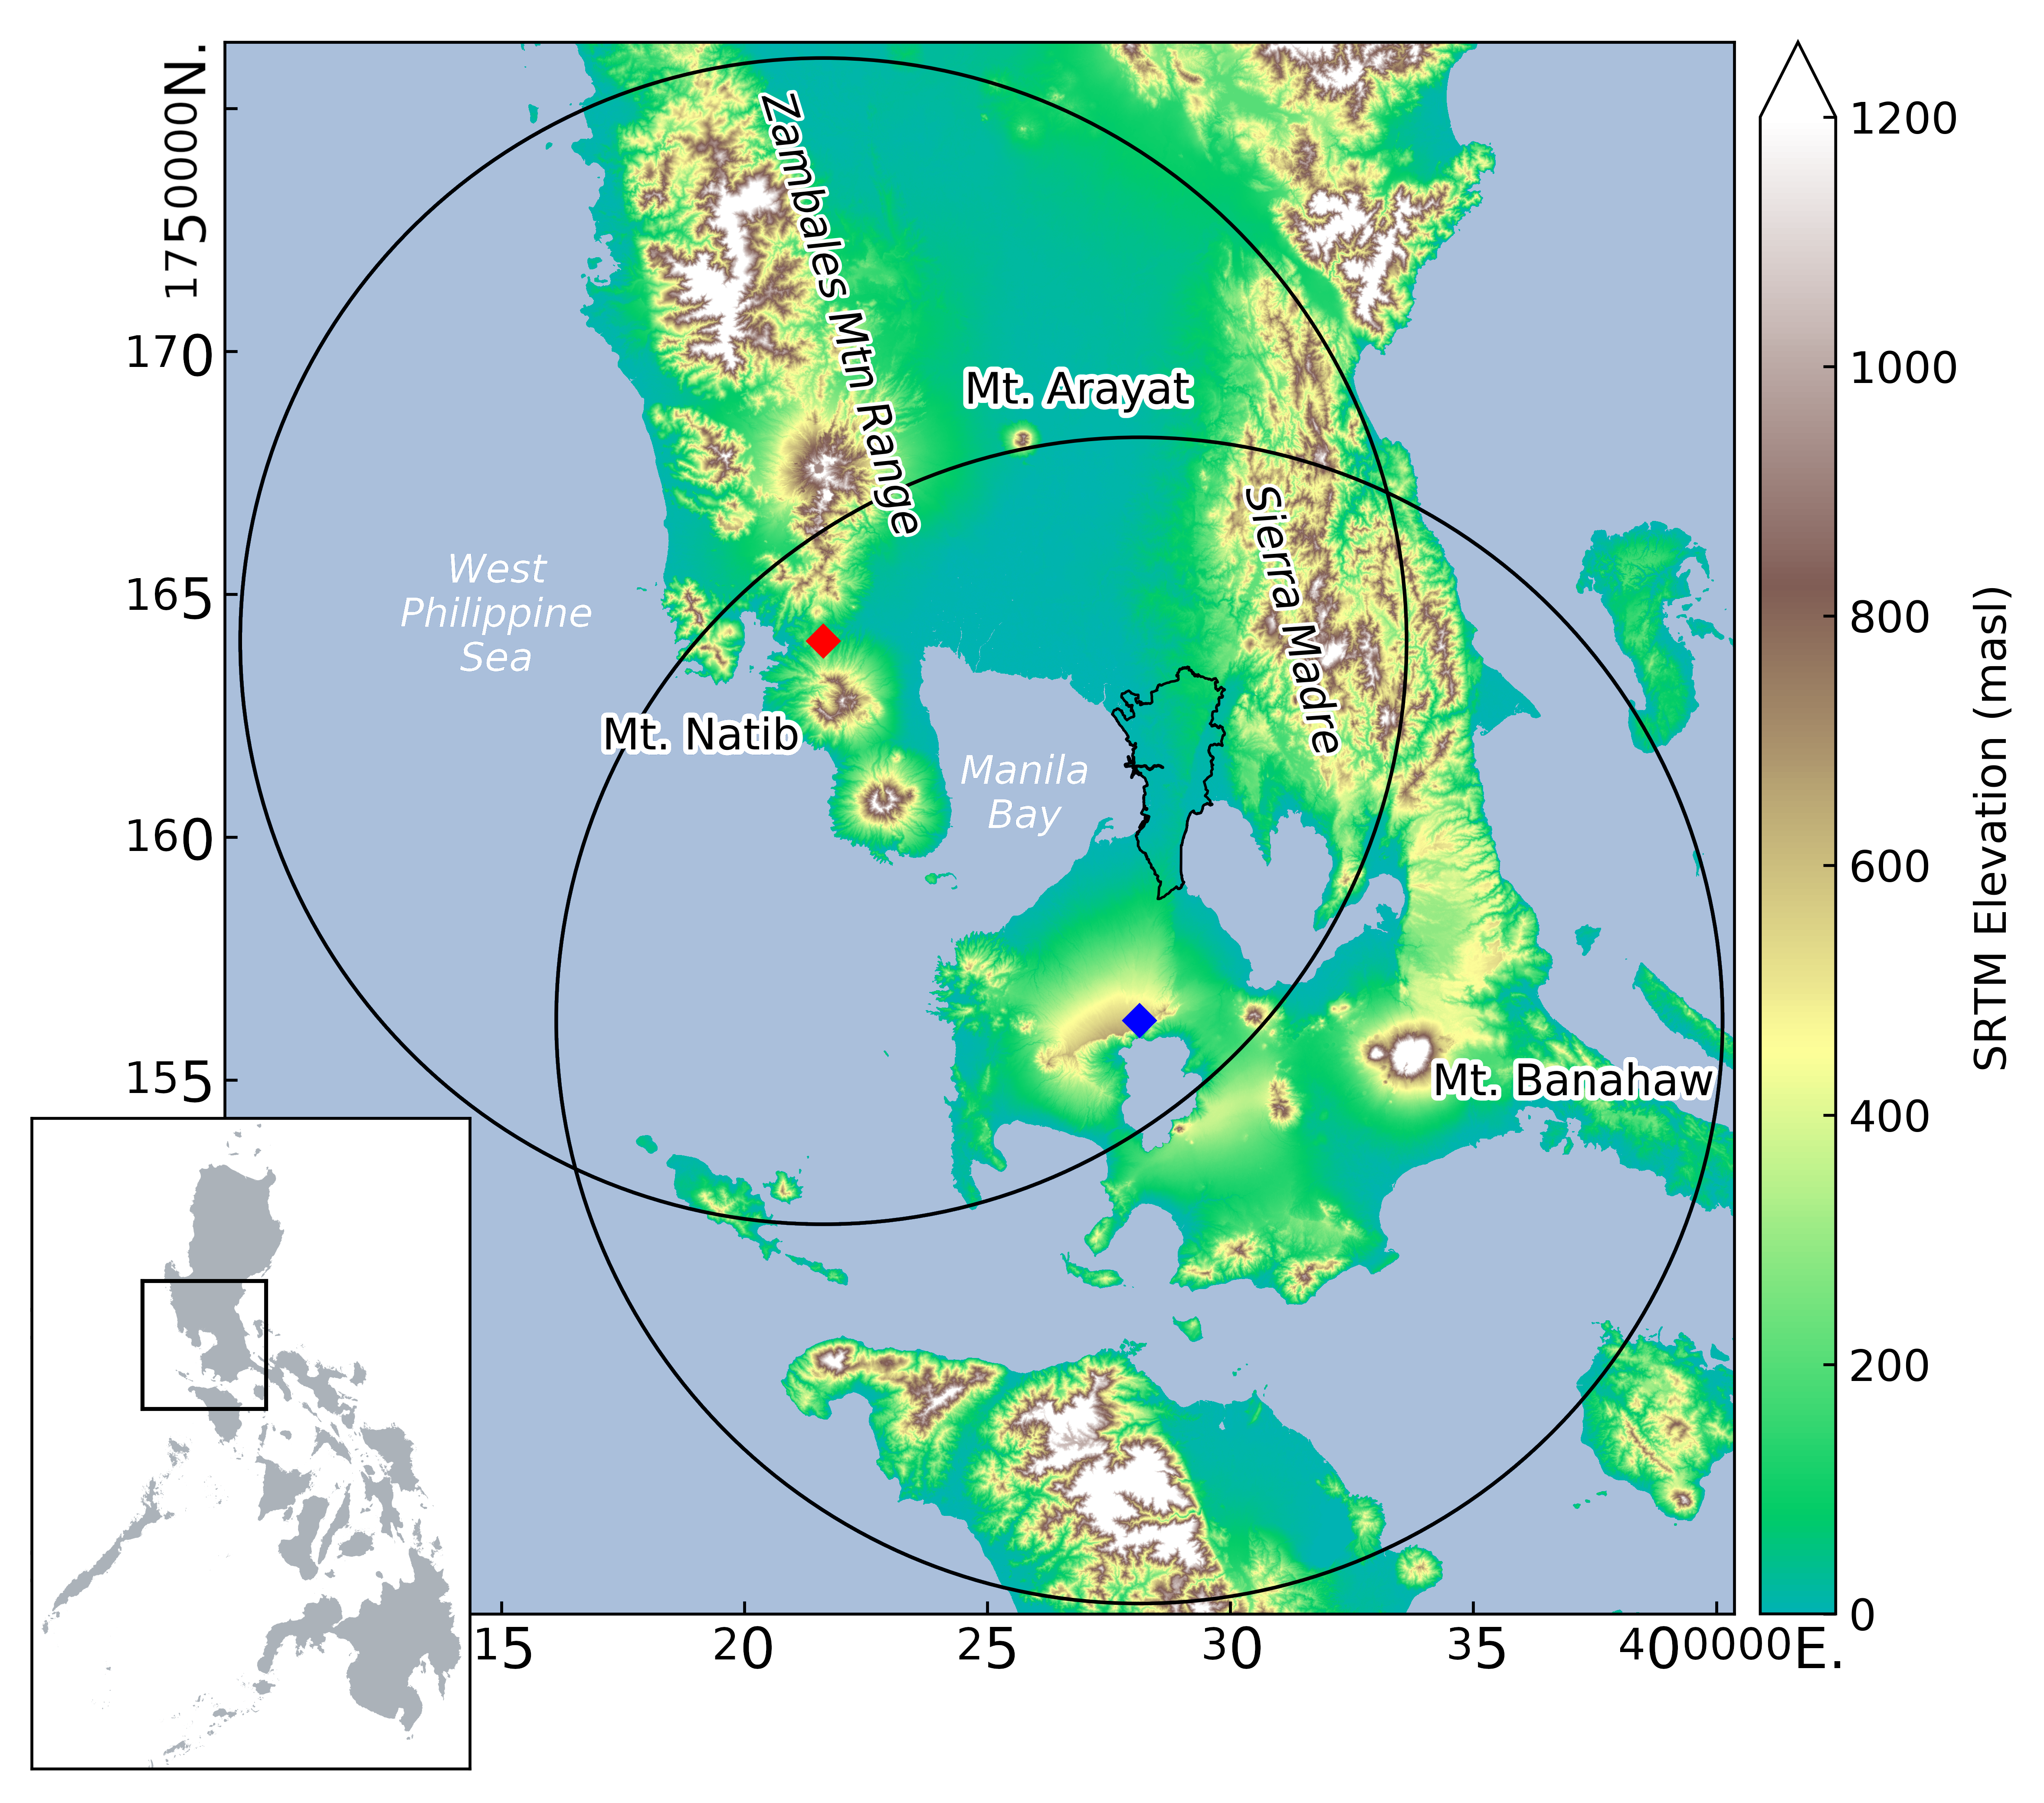
Figure 1.3: Subic (red diamond) and Tagaytay (blue diamond) radars and their coverage. The underlying DEM shows the complex topography surrounding the radars. In both coverages lies Metropolitan Manila (in black outline), the country’s capital and most populated city.
The Philippine Atmospheric, Geophysical, and Astronomical Services Administration (PAGASA) established and began expanding the country’s radar network in 2012. There are 15 operational ground weather radars as of April 2019. This thesis focuses on investigating calibration biases of the two longest-running weather radars of the PAGASA radar network: the Subic and Tagaytay radars (Figure 1.3, which are about 100 km apart and overlap Metro Manila, the country’s most populated region.
References
Abon, C. C., C. P. C. David, and N. E. B. Pellejera. 2011. “Reconstructing the Tropical Storm Ketsana Flood Event in Marikina River, Philippines.” Hydrology and Earth System Sciences 15 (4): 1283–9. https://doi.org/10.5194/hess-15-1283-2011.
Lagmay, Alfredo Mahar F., Gerry Bagtasa, Irene A. Crisologo, Bernard Alan B. Racoma, and Carlos Primo C. David. 2015. “Volcanoes Magnify Metro Manila’s Southwest Monsoon Rains and Lethal Floods.” Frontiers in Earth Science 2: 36. https://doi.org/10.3389/feart.2014.00036.
Lagmay, Alfredo Mahar Francisco, Bernard Alan Racoma, Ken Adrian Aracan, Jenalyn Alconis-Ayco, and Ivan Lester Saddi. 2017. “Disseminating Near-Real-Time Hazards Information and Flood Maps in the Philippines Through Web-GIS.” Journal of Environmental Sciences 59 (September): 13–23. https://doi.org/10.1016/j.jes.2017.03.014.