1.2 The good and the bad
Weather radars bridged the gap between the synoptic scale observations of weather systems and the point scale human observations at weather stations (Fabry 2015). They allow for an understanding of atmospheric processes at the mesoscale, such as internal cyclone structures; the evolution of cyclones and tornadoes; the conversion from ice to water in the atmosphere; and cloud microphysics, among many other things. Fabry highlights the importance of weather radar applications by the following:
- Weather radars can predict the type, timing, location, and amount of precipitation, which are the most important components of weather forecasts (Lazo, Morss, and Demuth 2009);
- They can detect hazardous weather conditions, such as hail, severe thunderstorms, and tornadoes; and
- Weather radar data is available in real-time, enabling access to spatiotemporally high resolution weather information.
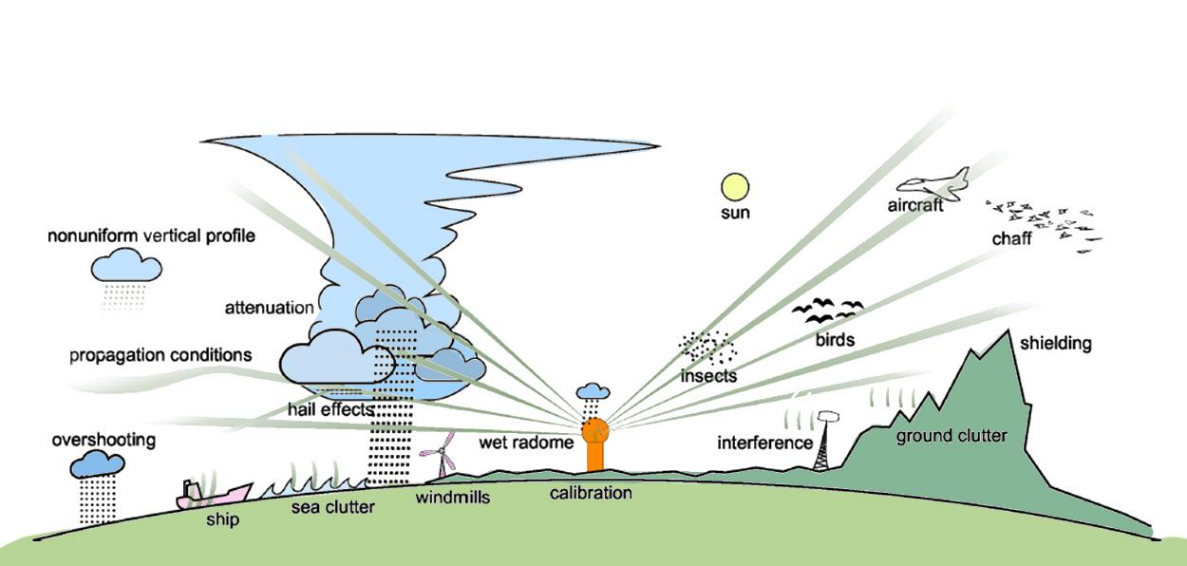
Figure 1.1: Sources of uncertainty in weather radar measurements (Peura et al., 2006)
As with any instrument, however, weather radars are not infallible to errors. Figure 1.1 illustrates the different factors that could affect the integrity of radar measurements . classified these error sources into nine categories: radar miscalibration; radar signal attenuation by rain; ground clutter and anomalous propagation; beam blockage; variability of the rainfall-rainrate (Z–R) relation; range effects; vertical variability of the precipitation system; vertical air motion and precipitation drift; and temporal sampling errors.
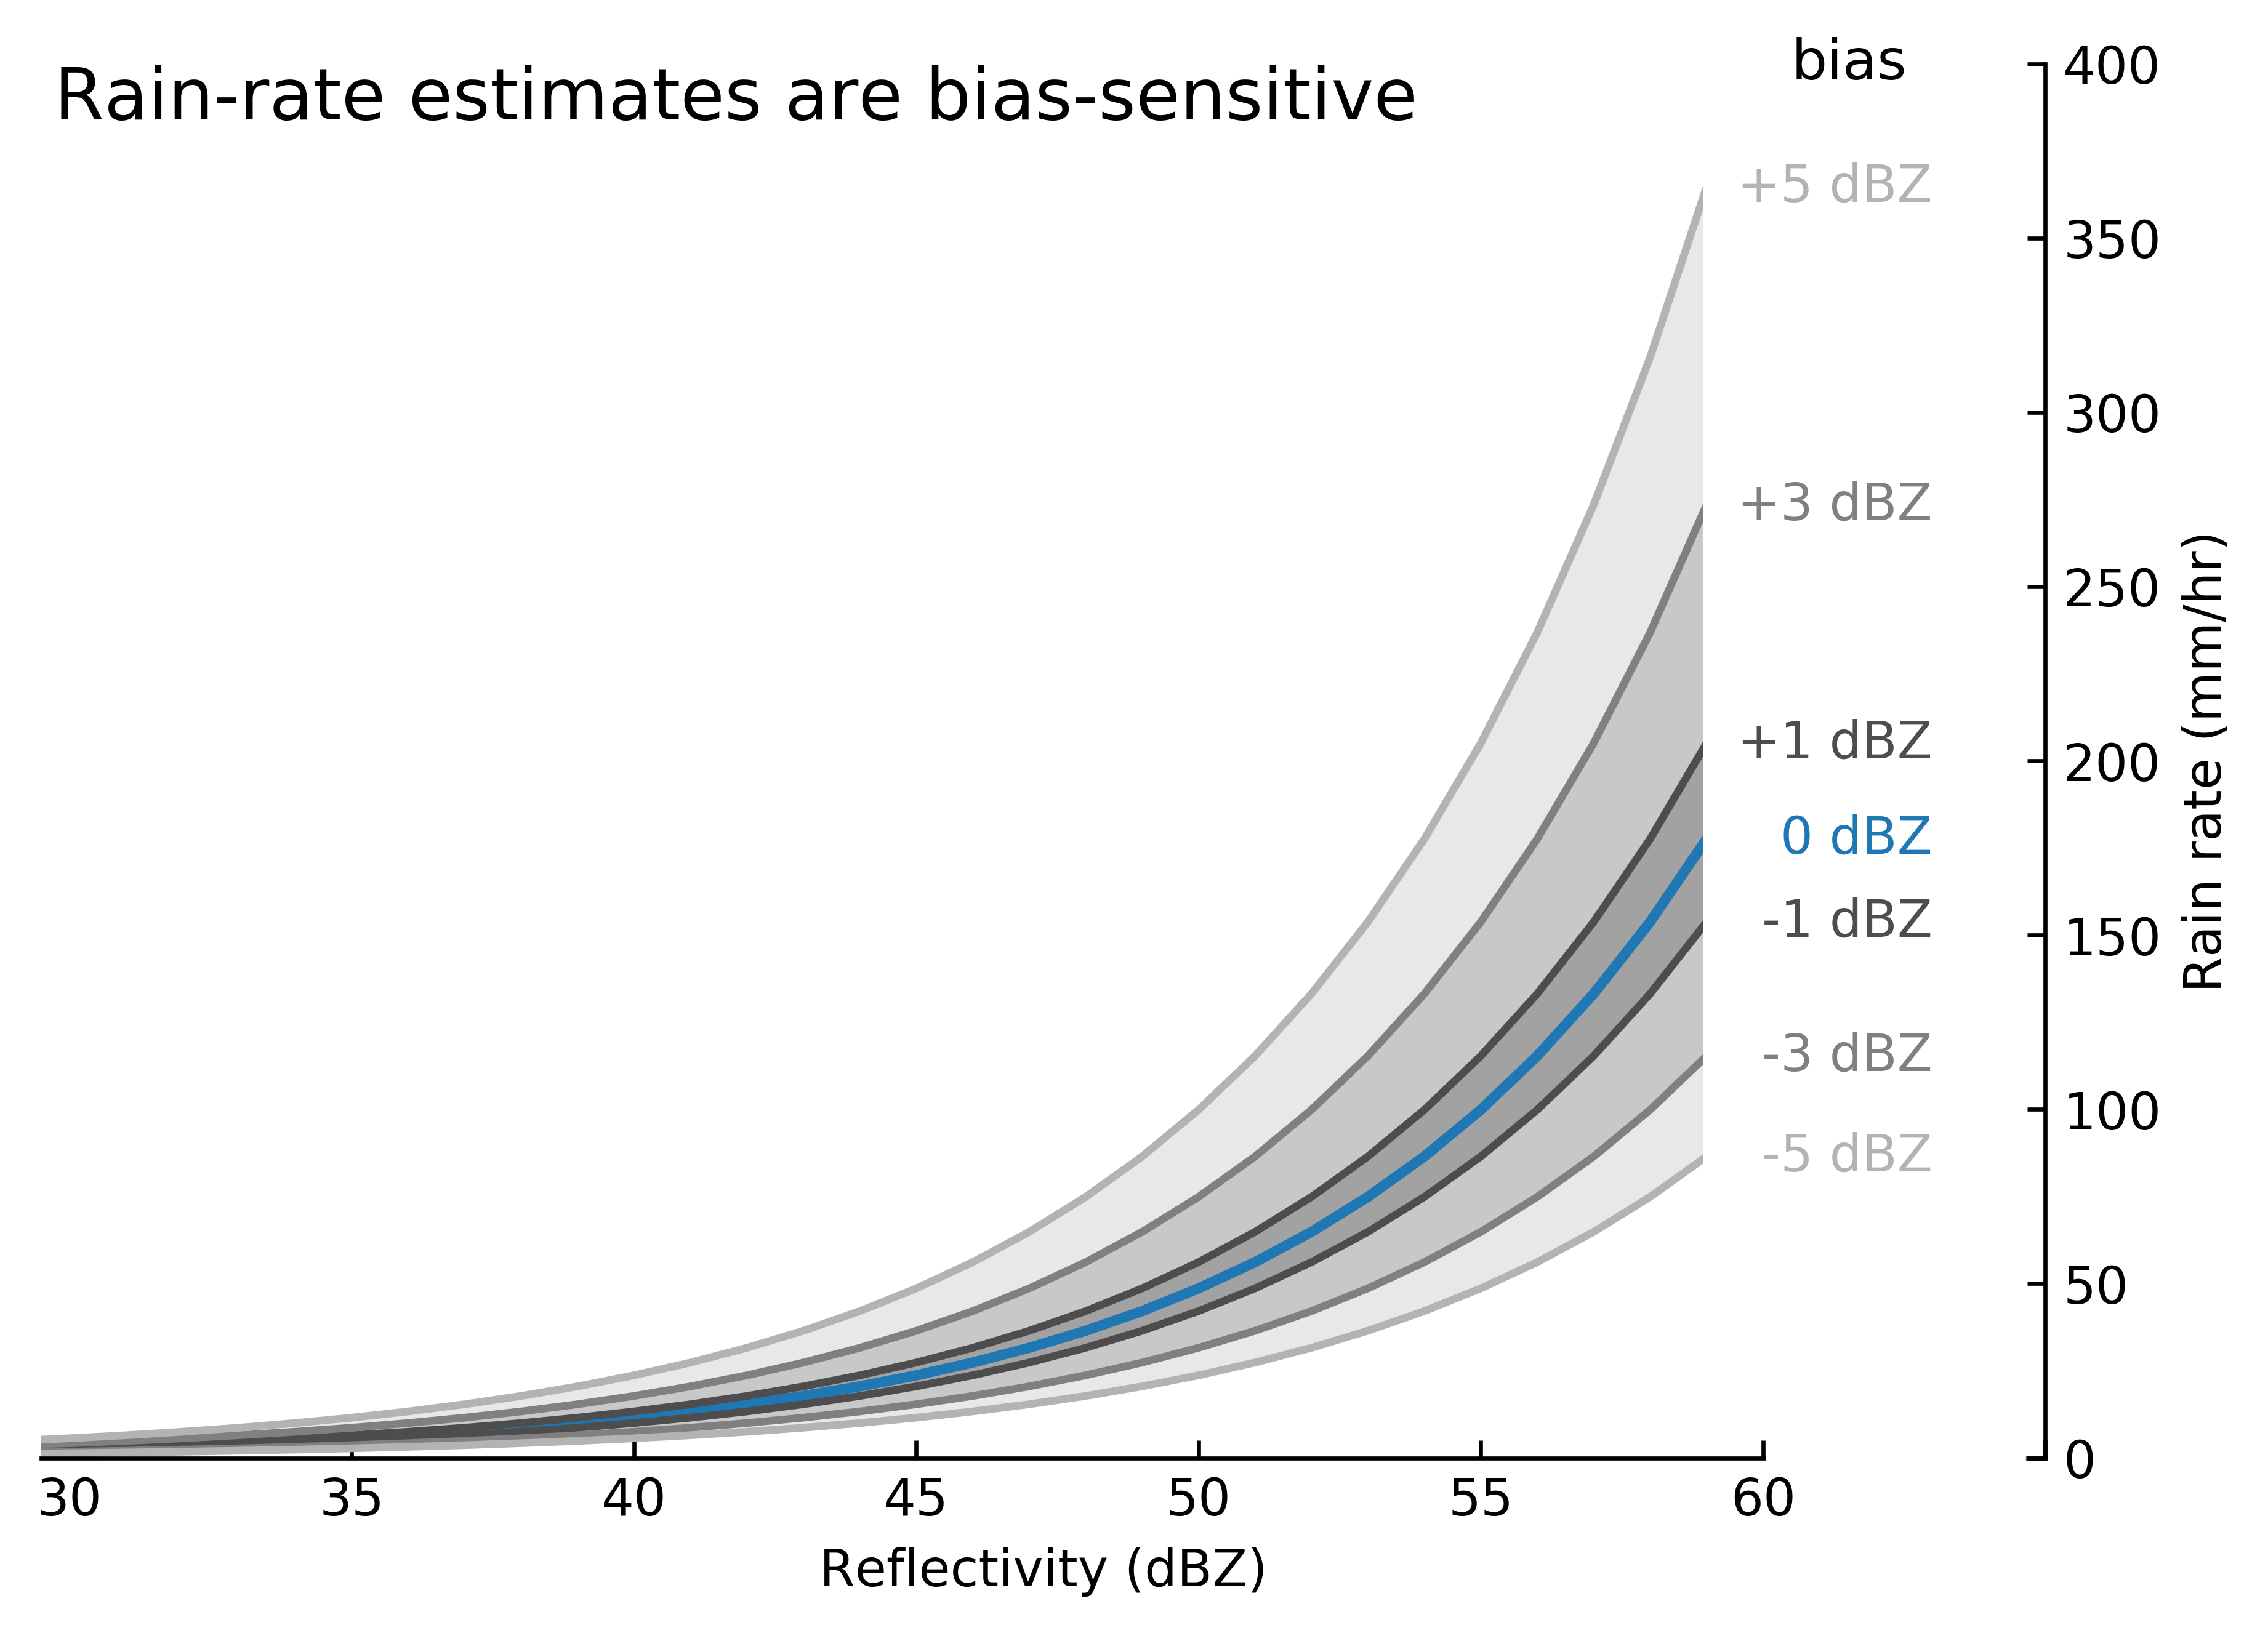
Figure 1.2: Reflectivity vs rain-rate estimates for different calibration biases. The base Z–R relationship (in blue) shows the standard Marshall-Palmer Z–R relationship (\(Z=200R^{1.6}\)). Z–R scenarios for different degrees of calibration biases are shown in dark gray (\(\pm\) 1 dBZ), medium gray (\(\pm\) 3 dBZ), and light gray (\(\pm\) 5 dbZ).
Radar (mis)calibration contributes the most to the deterioration of rainfall estimation accuracy . This is no surprise, as the exponential nature of the Z–R relationship means that a slight change in reflectivity could mean a big change in the estimated rain-rate. The standard Marshall-Palmer Z–R relationship can be used to demonstrate how the rain-rate estimates from reflectivity change depending on varying degrees of calibration biases (Figure 1.2. The effects of calibration bias are minimal at the lower range reflectivities. However, even a 1 dB change in bias could mean a difference of 25 mm/hr for the higher reflectivity ranges, which usually means intense rainfall, even though 1 dB accuracy is already considered well-calibrated. A seemingly small 3 dB underestimation could already mean that a 100 mm/hr rain—which could trigger landslides and/or flash floods—would have been measured as only 65 mm/hr. Such inaccuracies at the higher end of the reflectivity range could be disastrous. In the case of flood forecasting, for example, rainfall estimation errors could further accumulate throughout hydrologic and flood models, deeming event prediction no longer reliable.
References
Fabry, Frédéric. 2015. Radar Meteorology: Principles and Practice. Cambridge: Cambridge University Press. 10.1017/CBO9781107707405.
Lazo, Jeffrey K., Rebecca E. Morss, and Julie L. Demuth. 2009. “300 Billion Served: Sources, Perceptions, Uses, and Values of Weather Forecasts.” Bulletin of the American Meteorological Society 90 (6): 785–98. https://doi.org/10.1175/2008BAMS2604.1.