3.4 Results and discussion
3.4.1 Single event comparison
From the 183 TRMM and 103 GPM overpasses that intersected with the 120 km Subic radar range, only 74 TRMM and 40 GPM overpasses were considered valid after applying the selection criteria listed in Table 3.2. In order to get a better idea about the overall workflow, we first exemplify the results for two specific overpass events—one for TRMM, and one for GPM.
3.4.1.1 Case 1: 08 November 2013
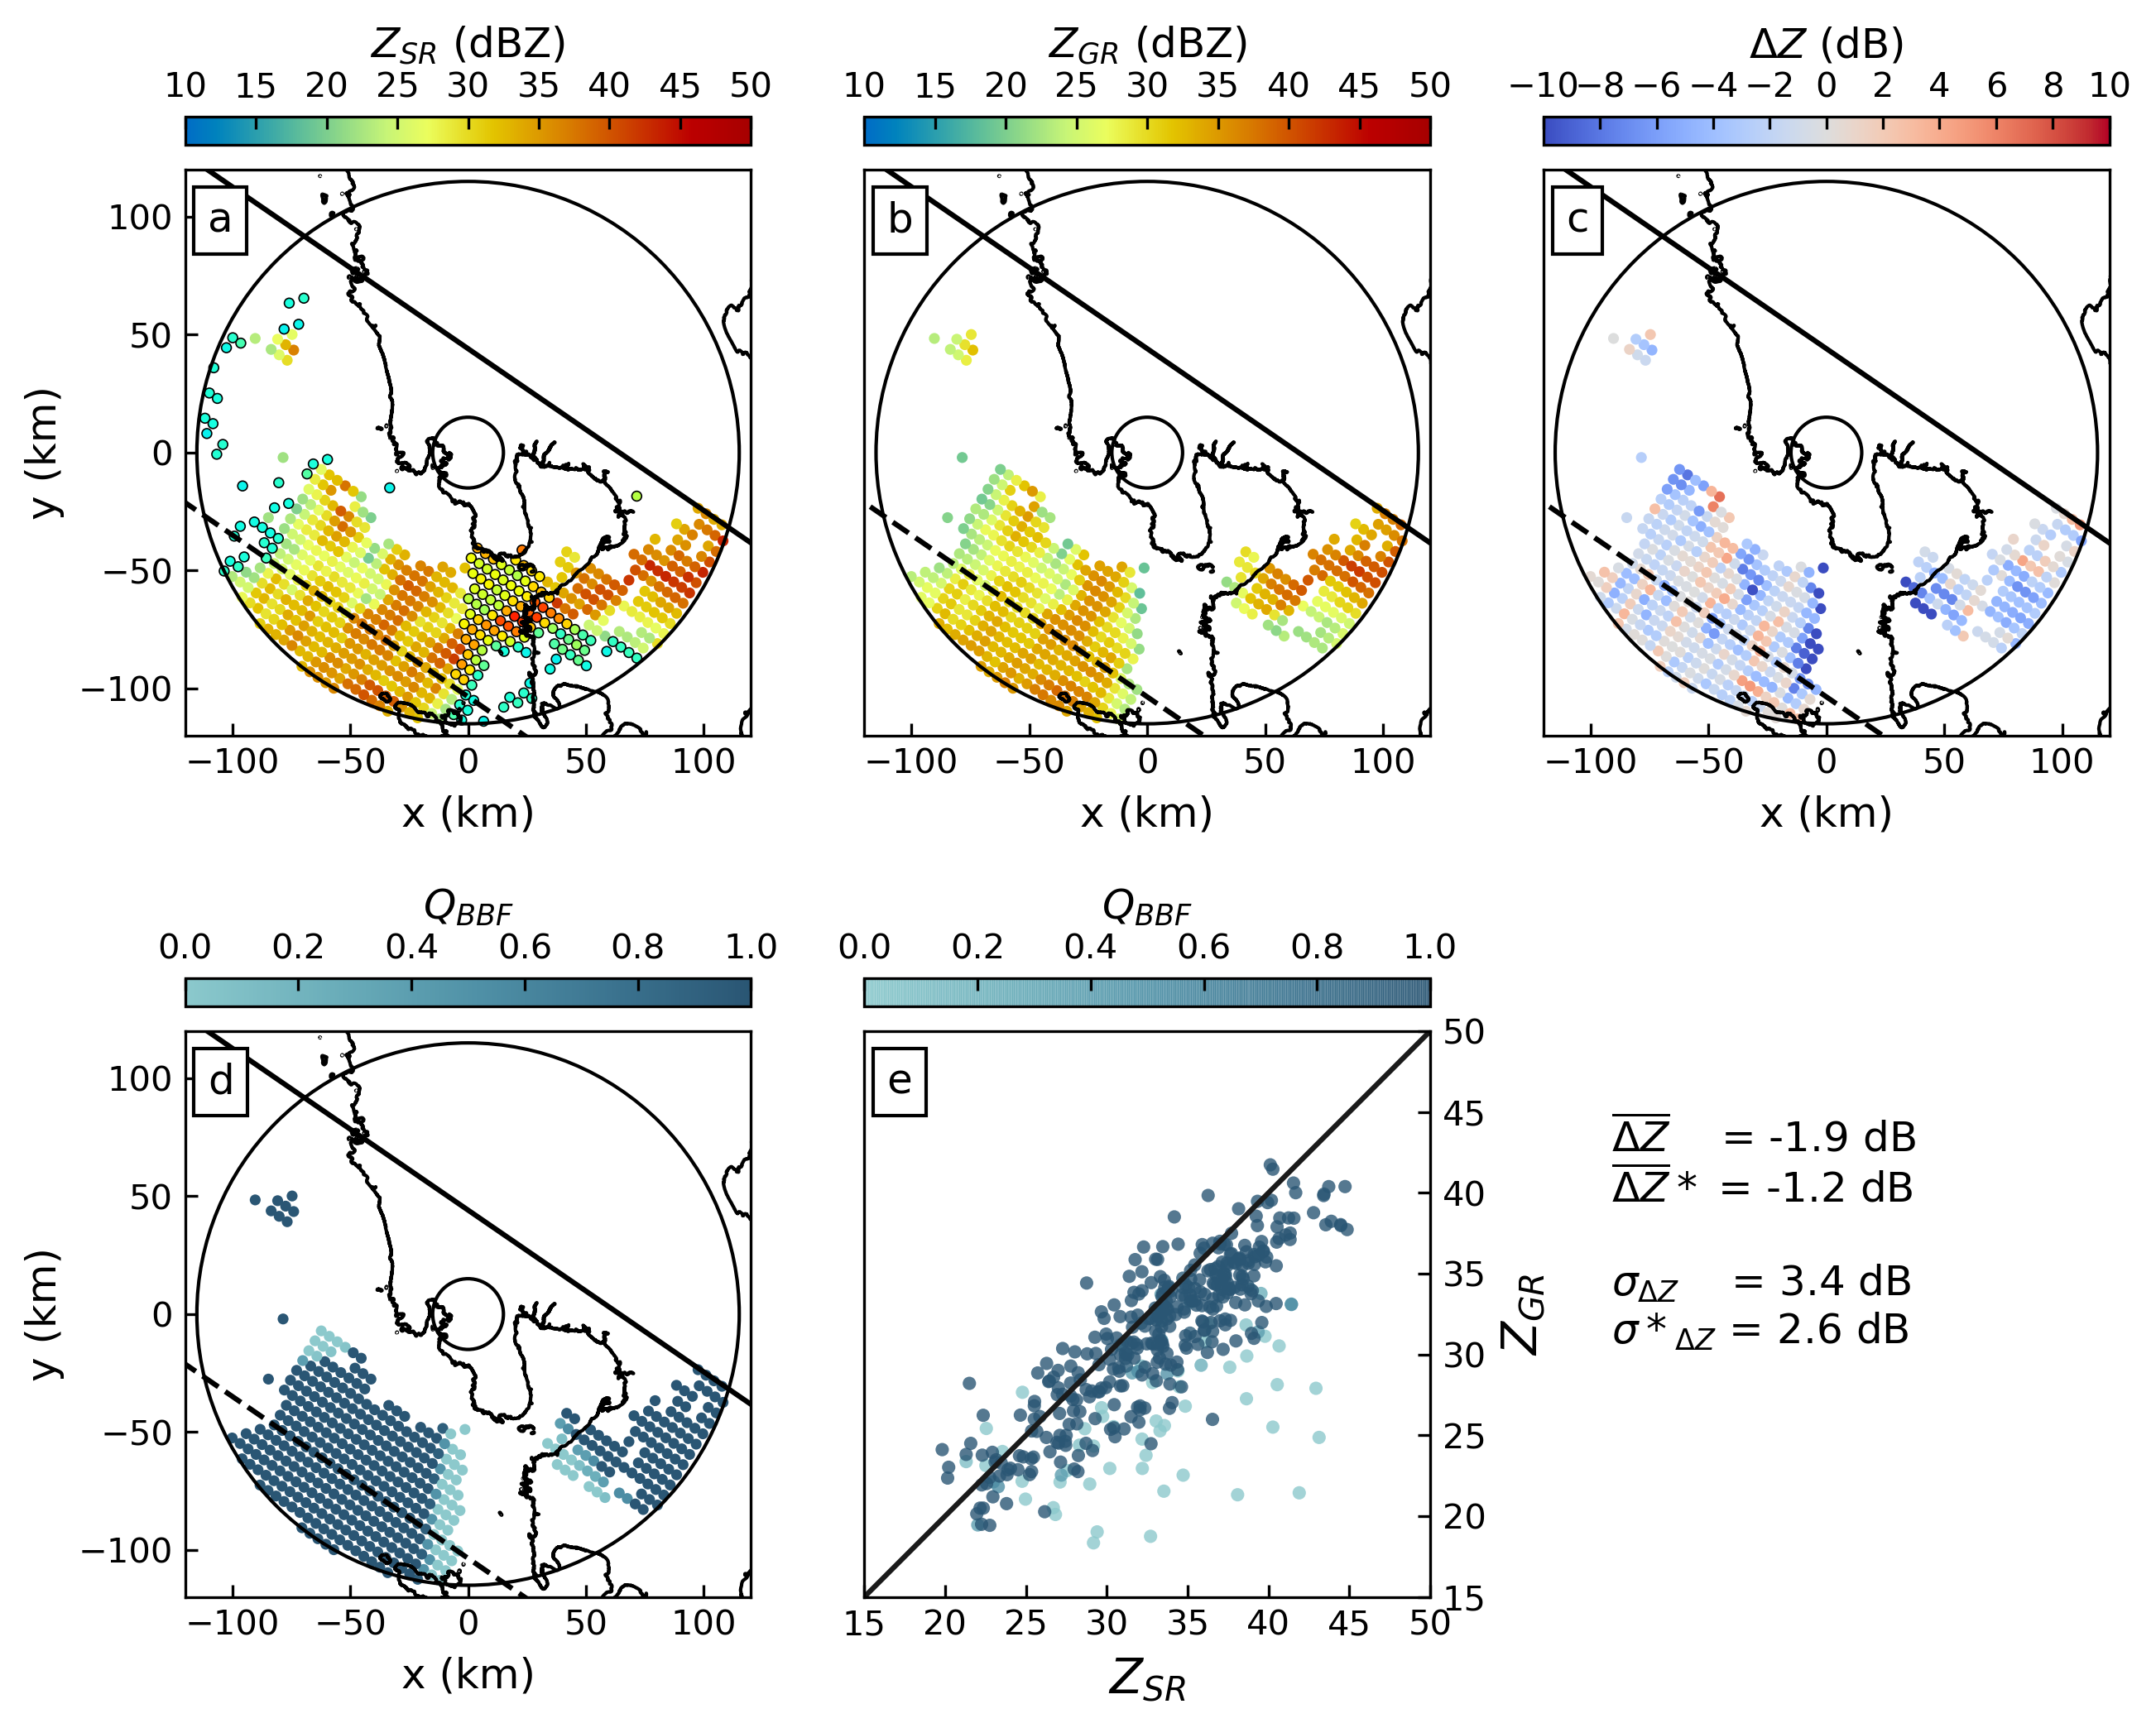
For the TRMM overpass event on November 8, 2013, the top row of Figure 3.5 shows SR (a) and GR (b) reflectivity as well as the resulting differences (c) for matching samples at an elevation angle of 0.5\(^{\circ}\). Each circle in the plots represents a matched volume. A corresponding map of \(Q_{BBF}\) is shown in (d) while (e) shows a scatter plot of GR versus SR reflectivities, with points coloured according to their \(Q_{BBF}\). The reflectivity difference map and scatter plot indicate significant variability with absolute differences of up to and exceeding 10 dB. Large differences can be observed at the edges of the southern sector affected by beam blockage (cf. also Figure 3.2). Major parts of that sector did not receive any signal due to total beam blockage, highlighted in Figure 3.5a with black circles showing the bins where the GR did not obtain valid observations. At the edges, however, partial beam blockage caused substantially lower GR reflectivity values. As expected, large negative differences of \(Z_{GR}\)–\(Z_{SR}\) are characterized by low quality.

Figure 3.5: GR-centered maps of volume-matched samples from 8 November 2013 at 0.5\(^{\circ}\) elevation angle of (a) SR reflectivity, (b) GR reflectivity, (c) difference between GR and SR reflectivities, and (d) \(Q_{BBF}\). (e) Scatter plot of \(Z_{GR}\) versus \(Z_{SR}\) where each point is coloured based on the data quality (\(Q_{BBF}\)). The solid line in (a)–(d) is the edge of the SR swath, the other edge lies outside the figure. The dashed line denotes the central axis of the swath. The solid concentric circles demarcate the 15 km and 115 km ranges from the radar. In (a) observations that are present in the SR data but not detected by the GR are encircled in black. The mean brightband is at a height of 4685 meters.
Consequently, the estimate of the calibration bias substantially depends on the consideration of partial beam blockage (or quality). Ignoring quality (simple mean) yields a bias estimate of -1.9 dB while the quality-weighted average yields a bias estimate of -1.2 dB. Accordingly, the standard deviation is reduced from 3.4 to 2.6 dB, indicating a more precise bias estimate.
This case demonstrates how partial beam blockage affects the estimation of GR calibration bias. At a low elevation angle, substantial parts of the sweep are affected by total beam blockage. The affected bins are either below the detection limit, or they do not exceed the GR threshold specified in Table 3.2. As a consequence, these bins will not be considered in the matched samples and will thus not influence the bias estimate, irrespective of using partial beam blockage as a quality filter. At a higher elevation angle, though, the same bins might not be affected by total beam blockage, but by partial beam blockage, as also becomes obvious from Figure 3.2. Considering these bins in the matched samples will cause a systematic error in the estimate of calibration bias, unless we use the partial beam blockage fraction as a quality filter by computing a quality-weighted average of reflectivity. As a consequence, the effect of quality-weighted averaging (with partial beam blockage fraction as a quality variable) can be most pronounced at ``intermediate’’ elevation angles, depending on the specific topography and its location with respect to the ground.

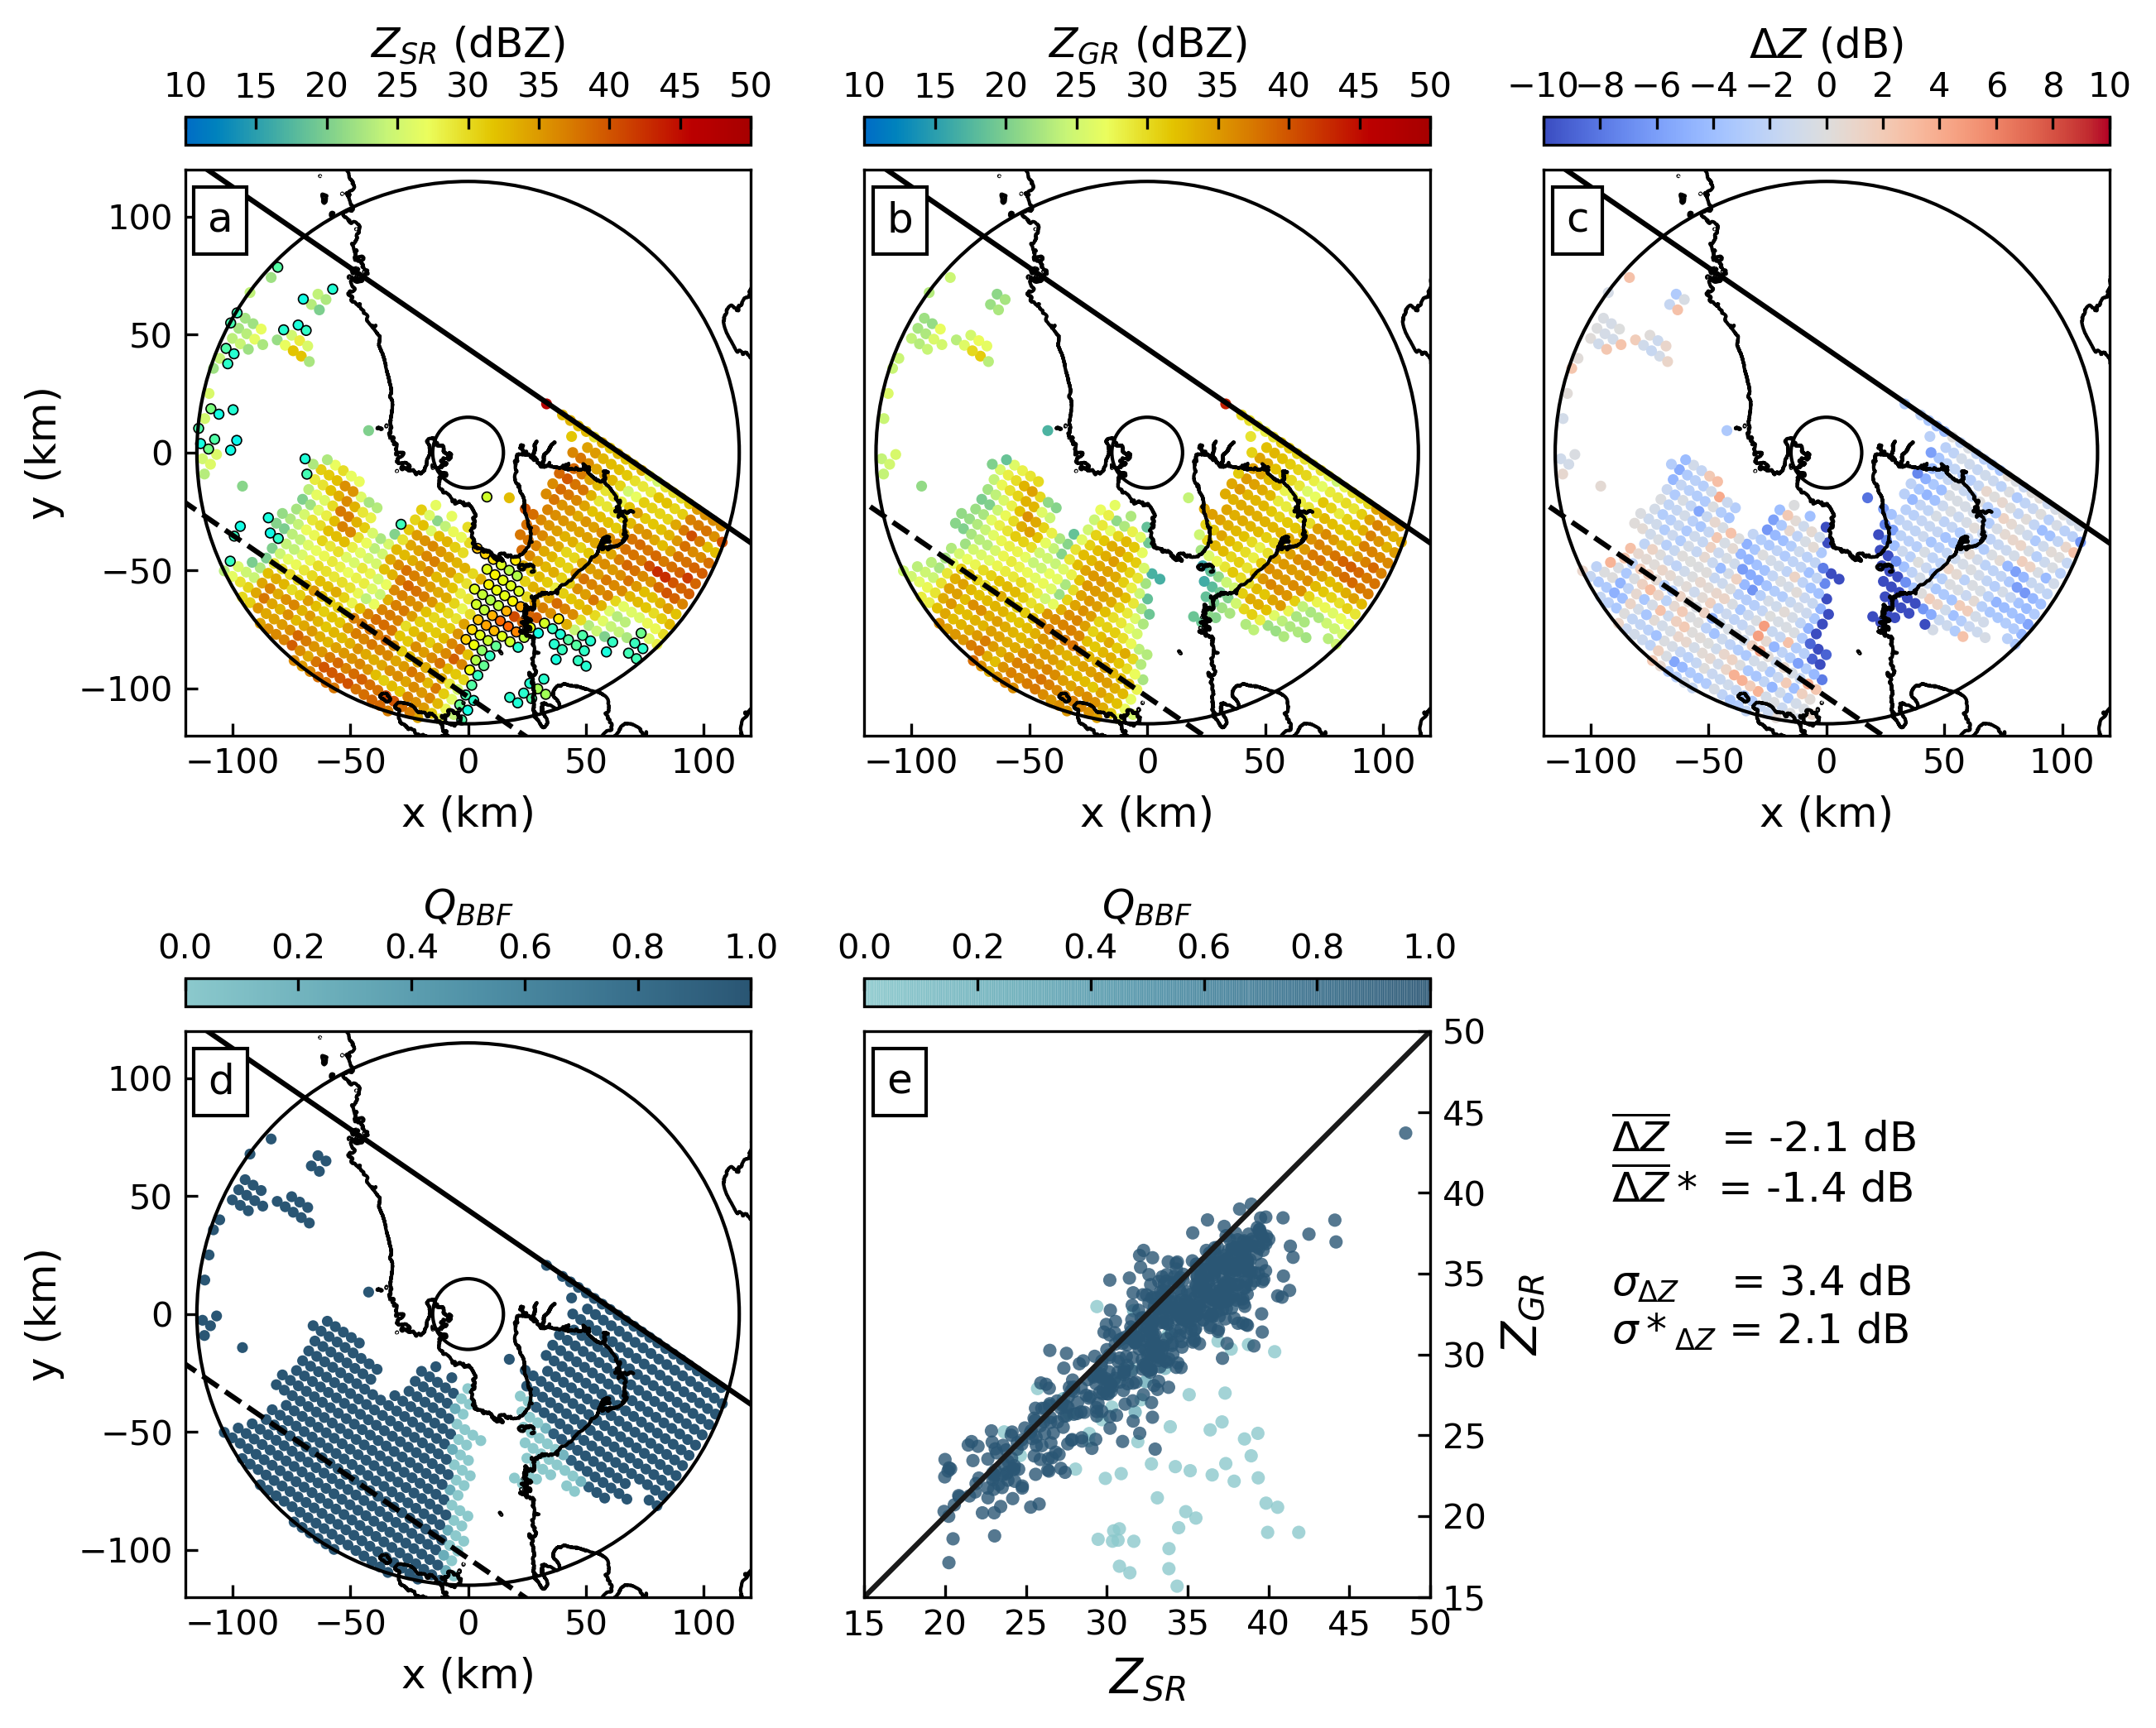
Figure 3.6: Same as in Figure 3.5 but for 1.5\(^{\circ}\) elevation angle.
The effect becomes obvious for the next elevation angle. Figure 3.6 is equivalent to Figure 3.5, but for an elevation angle of 1.5\(^{\circ}\): as the sector of total beam blockage shrinks at that elevation, the impact of partial beam blockage on the estimation of GR calibration bias increases. For an antenna elevation of 1.5\(^{\circ}\), some bins in areas of partial beam blockage have very large negative biases (over 20 dB). Ignoring beam blockage for this elevation angle yields a bias estimate of -2.1 dB (simple mean), while the quality-weighted average yields a bias of -1.4 dB. At the same time, considering quality substantially reduces the standard deviation from 3.4 dB to 2.1 dB.
3.4.1.2 Case 2: 01 October 2015
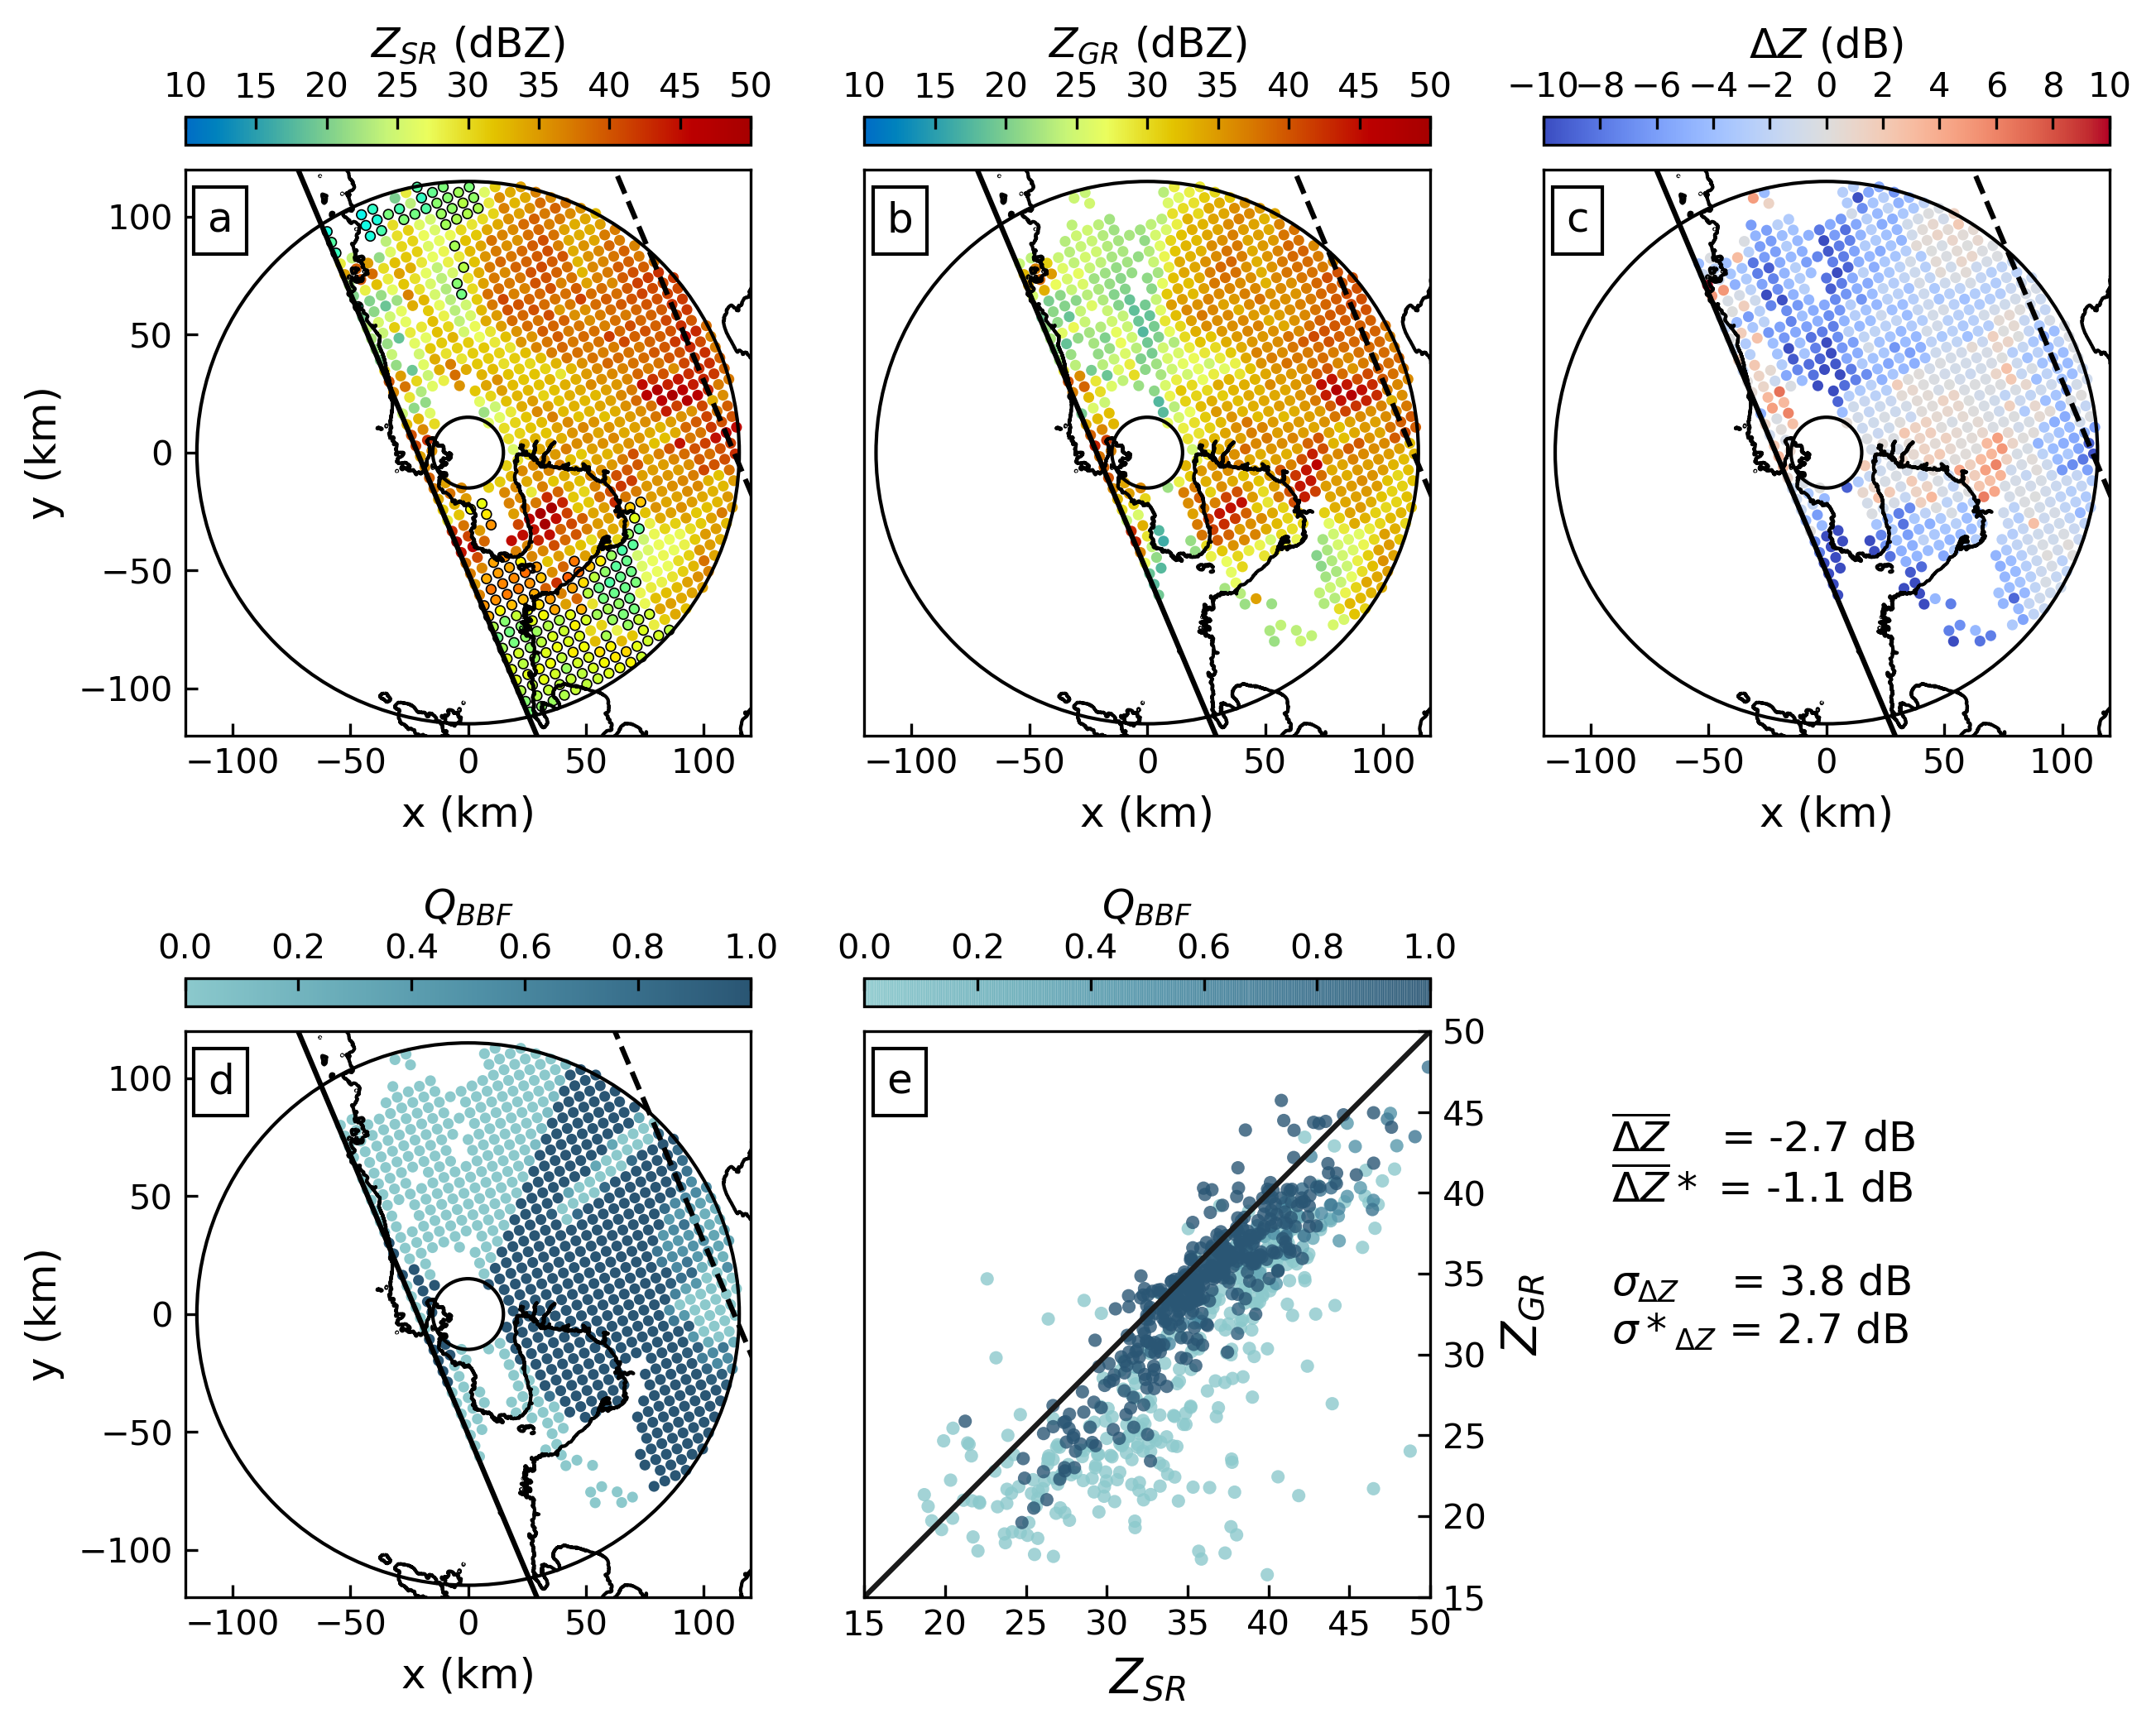
The second case confirms the findings in the previous section for a GPM overpass on October 1, 2015. That overpass captured an event in the northern and eastern part of the radar coverage where partial beam blockage is dominant, as well as a small part of the southern sector with partial and total beam blockage. Figure 3.7 shows the results of that overpass in analogy to the previous figures, for an antenna elevation of 0.0\(^{\circ}\). The figure shows a dramatic impact of partial beam blockage, with a dominant contribution from the northern part, but also clear effects from the eastern and southern sectors. The scatter plot of \(Z_{GR}\) over \(Z_{SR}\) in Figure 3.7e demonstrates how the consideration of partial beam blockage increases the consistency between GR and SR observations and allows for a more reliable estimation of the GR calibration bias: ignoring partial beam blockage (simple mean) yields a bias of {-2.7 dB}, while the quality-weighted average bias is -1.1 dB. Taking into account quality decreases the standard deviation from 3.8 dB to 2.7 dB.

Figure 3.7: As in Figure 3.5 but for the overpass on 01 October 2015. The mean brightband level is found at 4719 meters for this case.
3.4.2 Overall June–November comparison during the 5-year observation period
Finally, we applied both the simple and quality-weighted mean bias estimations to each of the TRMM and GPM overpasses from 2012 to 2016 that met the criteria specified in Section 3.3.2, Table 3.2. As pointed out in Section 3.3.2, the matching procedure itself is carried out per GR sweep, i.e. separately for each antenna elevation angle.

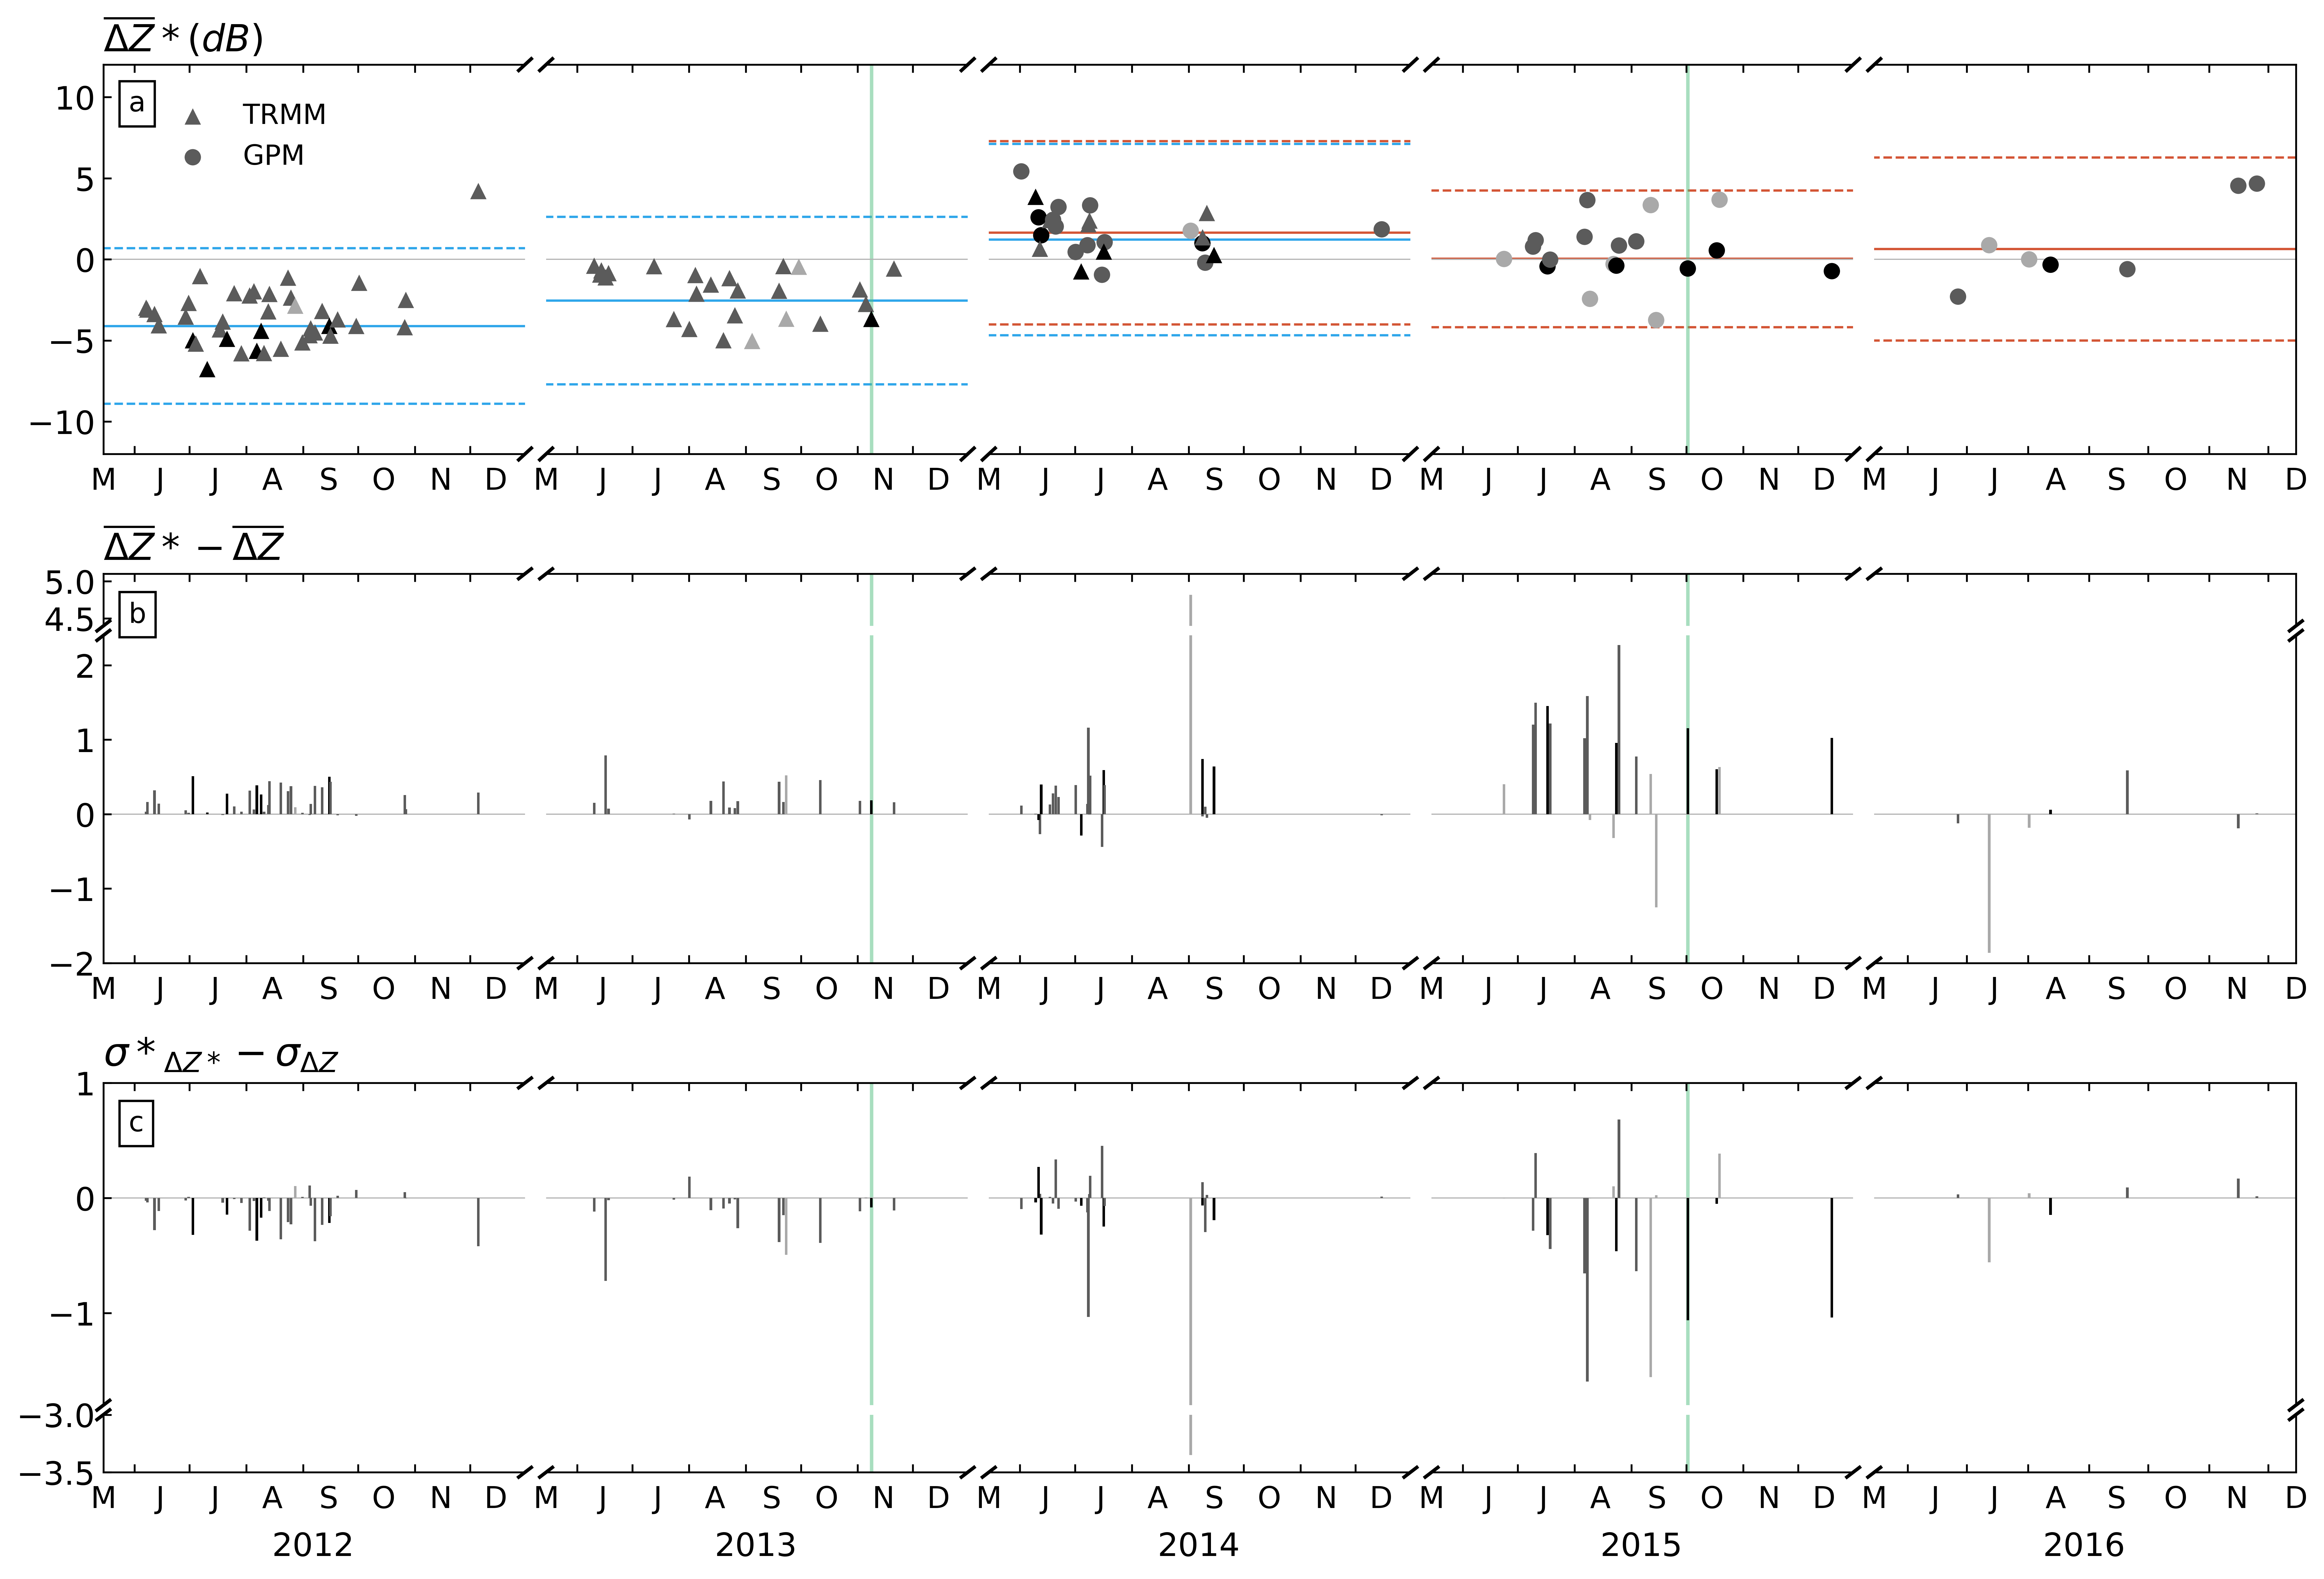
Figure 3.8: (a) Time series of the weighted mean bias (\(\Delta Z ^*\)) from 2012 to 2016. Analysis covers only the wet season from June to December. Triangle markers represent TRMM overpasses while circle markers are GPM overpasses. Symbols are coloured according to the number of volume-matched samples on a logarithmic scale: light grey: 10–99, medium grey: 100–999, and black: 1000+. Blue and orange solid (dashed) horizontal lines represent the weighted average (standard deviation) of all individual matched samples within the year for TRMM and GPM, respectively. (b) The difference between the weighted mean biases (\(\Delta Z ^*\)) and the simple mean biases (\(\Delta Z\)). (c) The standard deviation of the weighted mean bias minus the standard deviation of the simple mean bias values. The green vertical lines indicate the dates of the two case studies.
As a result, we obtain a time series of bias estimates for GR calibration, as shown in Figure 3.8. In this figure, the calibration bias for each overpass is computed from the full GR volume, i.e. including matched samples from all available antenna elevations. In the upper panel (a), each marker represents the quality-weighted mean bias for a specific SR overpass (circles for GPM, triangles for TRMM). The centre panel (b) highlights the differences between the quality-weighted and simple mean approaches, by quantifying the effect of taking into account GR data quality (in this case, partial beam blockage). The bottom panel (c) shows the differences between the quality-weighted standard deviation and the simple standard deviation of differences, illustrating how taking into account GR quality affects the precision of the bias estimates.
The time series provide several important insights.
Effect of quality-weighting on bias estimation. Figure 3.8b and c together illustrate the benefit of taking into account GR data quality (i.e. beam blockage) when we estimate GR calibration bias. It does not come as a surprise that the difference between \(\Delta Z^{*}\) and \(\Delta Z\) is mostly positive because the areas suffering from partial beam blockage register weaker signals (i.e. lower reflectivity) than expected, producing a lower mean bias. Giving the associated volume-matched samples low weights in the calculation of the mean bias brings the quality-weighted bias up. In the same vein, the beam-blocked bins introduce scatter, and assigning them low weights decreases the standard deviation. Figure 3.8c shows, as a consequence, that the quality-weighted bias estimates are consistently more precise: in the vast majority of overpasses, the quality-weighted standard deviation is substantially smaller than the simple standard deviation. That result is also consistent with the case study result shown above. It should be noted, though, that for some overpasses, the quality-weighting procedure (which is in effect a filtering) can cause an increase in the bias estimate and/or the standard deviation of that estimate. That effect occurs for overpasses with particularly low numbers of matched samples, and, presumably, with rainfall in regions in which our estimated beam blockage fraction is subject to higher errors (caused by e.g. the inadequateness of the assumed Gaussian antenna pattern, variability of atmospheric refractivity, or errors related to the DEM, its resolution and its interpolation to ground radar bins). In total, however, the effect of decreasing standard deviation vastly dominates. %However, when the matched sample size is already small, further filtering of samples increases the standard deviation.
GPM and TRMM radars are consistent. In 2014, both TRMM and GPM overpasses are available. That period of overlap shows that the GR calibration bias estimates that are based on both TRMM and GPM observations can be considered homogeneous. Using TRMM data, the average calibration bias for all 2014 overpasses amounts to 1.6 \(\pm\) 1.3 dB, while using the GPM overpasses yields a bias of 1.8 \(\pm\) 1.5 dB. The difference between TRMM version 7 and GPM version 5 reflectivities mentioned in Section 3.2.1 falls within the uncertainties in the annual estimated mean bias, which makes us confident that the substantial year-to-year changes in our bias estimates are based on changes in GR calibration.
Change in bias over time: Despite the variability of bias estimates between the individual overpass events, the time series still provides us with a clear signal: the bias estimates appear to fluctuate around an average value that appears to be quite persistent over the duration of the corresponding wet seasons of the different years, i.e. over intervals of several months. Considering the average calibration bias over the different wet seasons (horizontal lines in Figure 3.8a), we can clearly observe changes in calibration bias over time. The bias was most pronounced in 2012 and 2013, with average bias estimates around -4.1 dB for 2012 and -2.5 dB for 2013. For 2014, the absolute calibration bias was much smaller, at a level of 1.4 dB, while for 2015 and 2016, the situation improved further, with an average bias of 0.0 dB in 2015 and 0.6 dB in 2016. It is important to note that these values were computed as the average bias and its standard deviation across all matched volumes and not as the average of bias estimates across overpasses. Accordingly, the standard deviation (as indicated by the dashed lines) is quite high since it includes all the scatter from the individual overpasses. We have to assume that a fundamental issue with regard to calibration maintenance was addressed between 2013 and 2014 in the context of hardware changes (i.e. replacement of magnetron). Unfortunately, we were not able to retrieve detailed information on maintenance operations that might explain the changes in bias of the radar throughout the years.
Short-term variability of bias estimates between overpasses. There is a strong variability of the estimated calibration bias between overpasses (Figure 3.8a) and spatially within each overpass (Figures 3.5 to 3.7). That variability is clearly not a desirable property, as we would not expect changes in calibration bias to occur at the observed frequency, amplitude, and apparent randomness. As a consequence, we have to assume that the variability is a cumulative result of various and dynamic sources of uncertainty along the entire process of observation, product generation, matching, and filtering. That assumption is well in line with many other studies (such as Anagnostou, Morales, and Dinku (2001), Durden et al. (1998), Joss et al. (2006), Kim et al. (2014), Meneghini et al. (2000), Rose and Chandrasekar (2005), Schwaller and Morris (2011), Seto and Iguchi (2015), J. Wang and Wolff (2009), Warren et al. (2018), to name only a few) which discuss e.g. fundamental issues with the backscattering model for different wavelengths and sampling volumes; the uncertainty of beam propagation subject to fluctuations in atmospheric refractivity; residual errors in the geometric intersection of the volume samples; uncertainties in SR reflectivity subject to the effects of attenuation correction at Ku-band, non-uniform beam filling and undesirable synergies between the two; rapid dynamics in backscattering target during the time interval between SR overpass and GR sweep; effects of non-meteorological echoes for both SR and GR; and, presumably, also short-term hardware instabilities. Considering these uncertainties, together with the fact that the quality-weighting in our case study explicitly accounts for beam blockage only, the short-term variability becomes plausible. However, it is beyond the scope of this study to disentangle the sources of this variability.
References
Anagnostou, Emmanouil N., Carlos A. Morales, and Tufa Dinku. 2001. “The Use of TRMM Precipitation Radar Observations in Determining Ground Radar Calibration Biases.” Journal of Atmospheric and Oceanic Technology 18 (4): 616–28. http://journals.ametsoc.org/doi/abs/10.1175/1520-0426(2001)018%3C0616%3ATUOTPR%3E2.0.CO%3B2.
Durden, S. L., Z. S. Haddad, A. Kitiyakara, and F. K. Li. 1998. “Effects of Nonuniform Beam Filling on Rainfall Retrieval for the TRMM Precipitation Radar.” Journal of Atmospheric and Oceanic Technology 15 (3): 635–46. https://doi.org/10.1175/1520-0426(1998)015<0635:EONBFO>2.0.CO;2.
Joss, Jürg, Marco Gabella, Silas C. h r Michaelides, and Giovanni Perona. 2006. “Variation of Weather Radar Sensitivity at Ground Level and from Space: Case Studies and Possible Causes.” Meteorologische Zeitschrift, November, 485–96. https://doi.org/10.1127/0941-2948/2006/0150.
Kim, Ji-Hye, Mi-Lim Ou, Jun-Dong Park, Kenneth R. Morris, Mathew R. Schwaller, and David B. Wolff. 2014. “Global Precipitation Measurement (GPM) Ground Validation (GV) Prototype in the Korean Peninsula.” Journal of Atmospheric and Oceanic Technology 31 (9): 1902–21. https://doi.org/10.1175/JTECH-D-13-00193.1.
Meneghini, Robert, Toshio Iguchi, Toshiaki Kozu, Liang Liao, Ken’ichi Okamoto, Jeffrey A. Jones, and John Kwiatkowski. 2000. “Use of the Surface Reference Technique for Path Attenuation Estimates from the TRMM Precipitation Radar.” Journal of Applied Meteorology 39 (12): 2053–70. https://doi.org/10.1175/1520-0450(2001)040<2053:UOTSRT>2.0.CO;2.
Rose, C. R., and V. Chandrasekar. 2005. “A Systems Approach to GPM Dual-Frequency Retrieval.” IEEE Transactions on Geoscience and Remote Sensing 43 (8): 1816–26. https://doi.org/10.1109/TGRS.2005.851165.
Schwaller, Mathew R., and K. Robert Morris. 2011. “A Ground Validation Network for the Global Precipitation Measurement Mission.” Journal of Atmospheric and Oceanic Technology 28 (3): 301–19. https://doi.org/10.1175/2010JTECHA1403.1.
Seto, Shinta, and Toshio Iguchi. 2015. “Intercomparison of Attenuation Correction Methods for the GPM Dual-Frequency Precipitation Radar.” Journal of Atmospheric and Oceanic Technology 32 (5): 915–26. https://doi.org/10.1175/JTECH-D-14-00065.1.
Wang, Jianxin, and David B. Wolff. 2009. “Comparisons of Reflectivities from the TRMM Precipitation Radar and Ground-Based Radars.” Journal of Atmospheric and Oceanic Technology 26 (5): 857–75. https://doi.org/10.1175/2008JTECHA1175.1.
Warren, Robert A., Alain Protat, Steven T. Siems, Hamish A. Ramsay, Valentin Louf, Michael J. Manton, and Thomas A. Kane. 2018. “Calibrating Ground-Based Radars Against TRMM and GPM.” Journal of Atmospheric and Oceanic Technology, February. https://doi.org/10.1175/JTECH-D-17-0128.1.