1.6 Research questions and structure
The research questions and the corresponding answers in this thesis were developed in succession. The findings of Chapter 2 (Paper 1) gave rise to the second research question (Chapter 3; Paper 2), whose findings prompted the third research question (Chapter 4; Paper 3). The thesis story starts from the identification of the Subic radar miscalibration, to the quality-weighted calibration bias estimation through SR–GR comparison, and eventually the verification of the method through GR-GR comparison. Figure 1.4 gives an overview of the flow and the structure of the thesis.
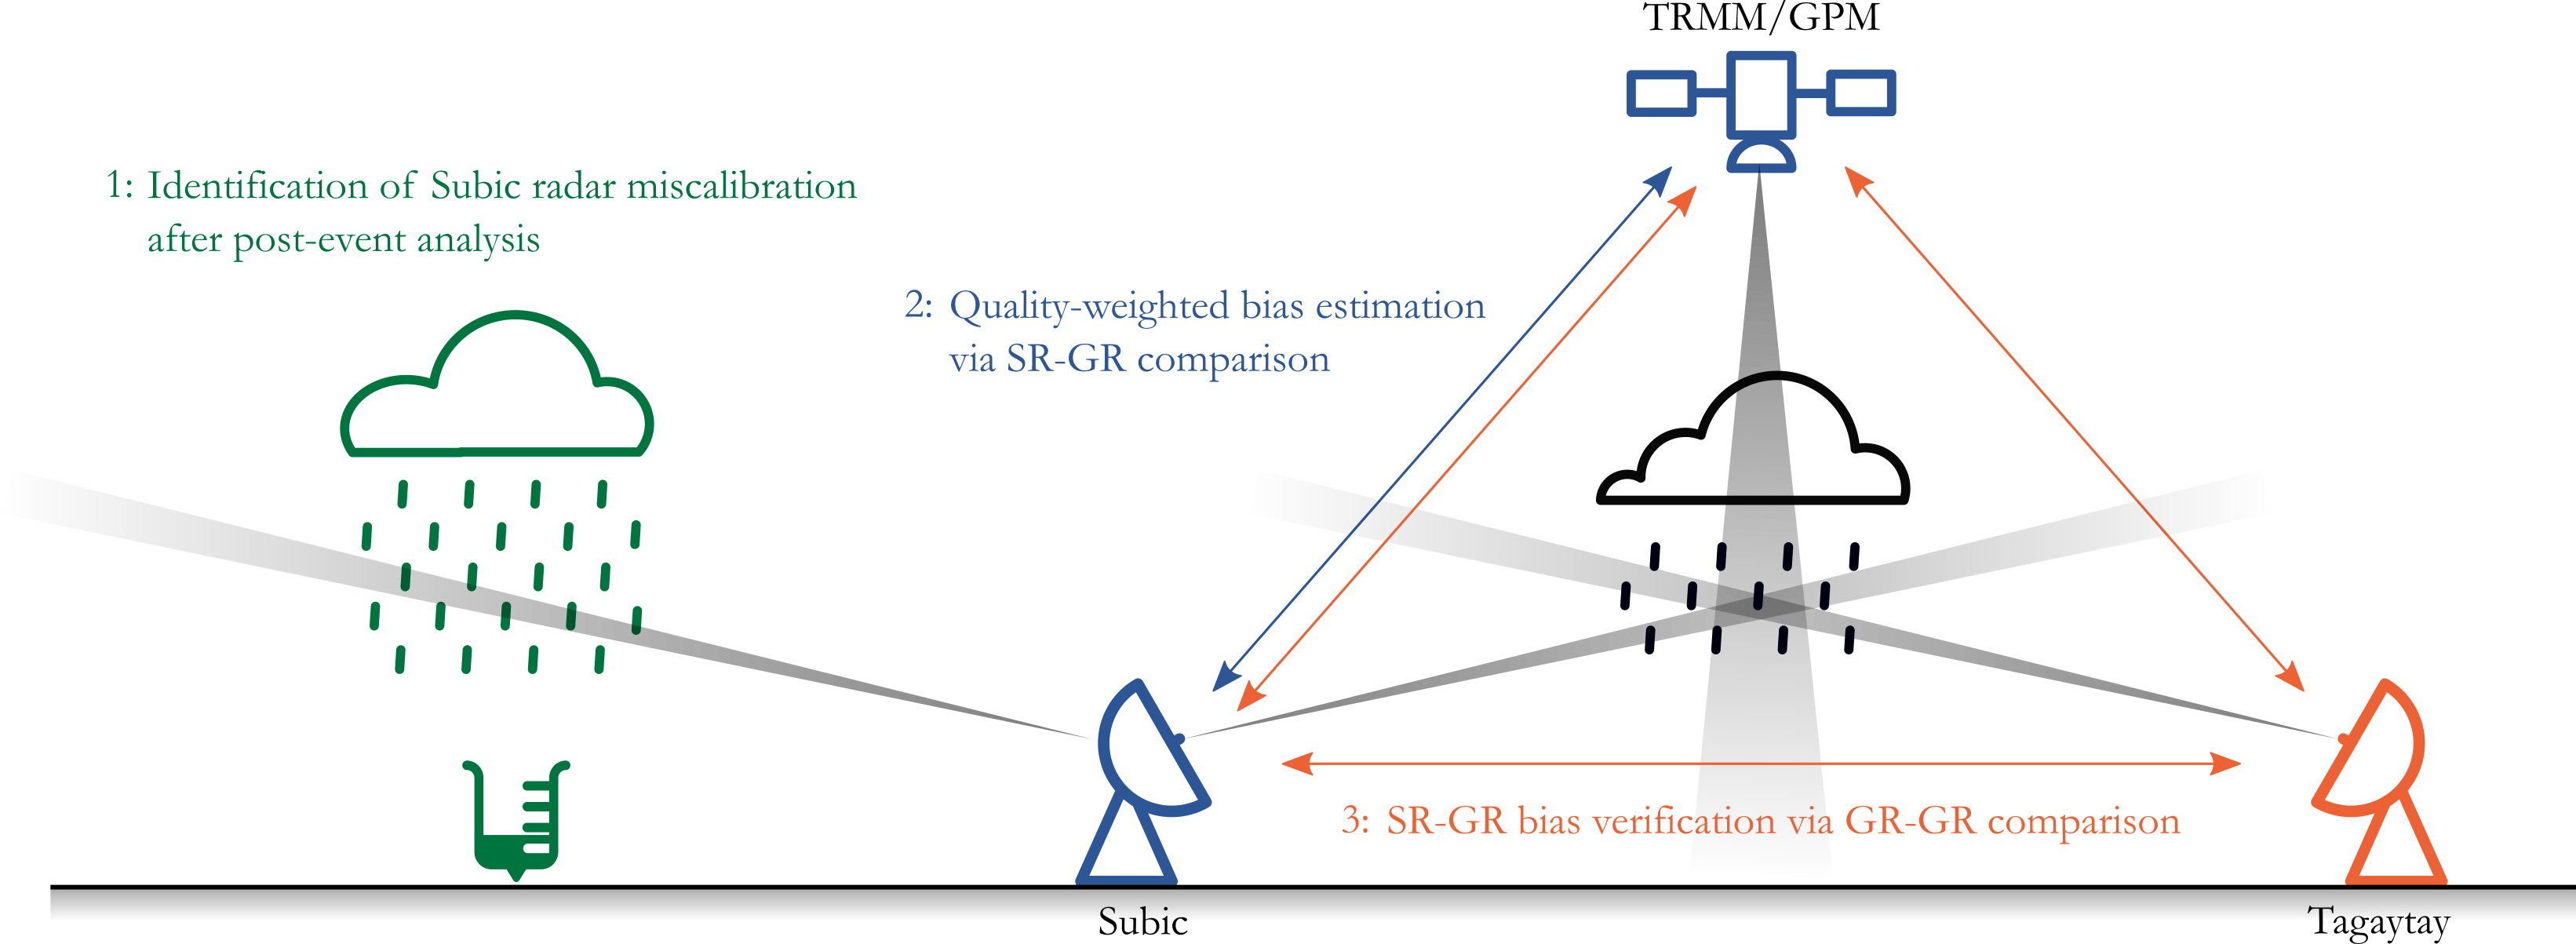
Figure 1.4: Schematic diagram of the research flow and structure
The use of radar in operations and research worldwide has been going on for decades. For the Philippines, the radar network has only been collecting and archiving data since 2012. The frequency of typhoons and other convective systems that define the country’s weather provides plenty of research potential in terms of understanding the underlying processes, as well as understanding the spatiotemporal distribution of rainfall. To explore the potential role of weather radars in understanding extreme weather in the Philippines, the first research question asks:
- RQ1: Can we use recently-acquired weather radar data to reconstruct the enhanced southwest monsoon event of 2012? What additional information can radars provide that are not offered by the rain gauges to explore the spatial distribution of rainfall?
The question is answered in the first chapter, where we made an initial attempt at examining the rainfall distribution for the Habagat 2012 rainfall event. This was a four-day event of continuous torrential precipitation, brought by southwest monsoon and enhanced further by a typhoon. Twenty-five (25) rain gauges captured the intensity of the event with a maximum accumulated rainfall of 1000 mm. When comparing radar estimates with actual gauge readings, we found that the radar underestimates rainfall by as much as 60%. We adjusted the radar estimates based on the rain gauge values and then produced a gauge-adjusted rainfall map over the Subic radar coverage. We learned from the rainfall distribution map that Manila already received 1000 mm of accumulated rain over the course of four days, whereas most of the accumulated rainfall (~1200 mm) fell over Manila Bay, which was impossible for the rain gauges to capture.
We observed from Chapter 2 that the Subic radar underestimates rainfall compared to the rain gauges, and that rain gauges are unable to adequately capture the spatial distribution of rainfall. Hence there is a need for another source to calibrate the weather radar data. We peered into the possibility of calibration of the Subic radar via spaceborne radars, following the study of Warren et al. (2018) and the method of Schwaller and Morris (2011). In addition, we wanted to explore the added value of considering data quality in comparing the two instruments, which leads to the second research question:
- RQ2: Are SR and GR observations consistent enough to allow for calibration bias estimates? Can we increase the level of consistency by introducing a formal framework for data quality (in terms of measurement quality)?
The second chapter looks at the underestimation of the Subic radar discovered in Chapter 1, and suggests a method to adjust the radar estimates in a more systematic manner. The rain gauge density within radar coverage is insufficient to create a reliable basis for adjustment, although it is a common practice as discussed in Chapter 2. Moreover, using gauges for calibration requires the additional step of converting reflectivity to rain rate, which could introduce another layer of uncertainty. In this chapter, we instead turn towards spaceborne radars. We compare the reflectivity measurements of the spaceborne radars with the reflectivity measurements of the ground radars by taking the values only at the volumes where the beams from the two radars intersect adapting the geometry matching method (Schwaller and Morris 2011). In addition, we quantify the effect of beam blockage caused by the terrain. We are able to estimate the fraction of the beam being blocked by the terrain and assign a quality index between 0 (bad quality) and 1 (good quality) by modeling the beam blockage map based on a digital elevation model (DEM). We then estimate the bias between SR and GR using the quality index as weights by taking a weighted mean of the differences of the reflectivities from the two instruments. We look at how the comparison of the two radars can be improved (i.e. reduction of the standard deviation) when the data quality based on beam blockage is considered in calibration bias estimation.
Another question is whether the SR–GR calibration method also works for a C-Band radar with a different dominating quality factor (e.g. path-integrated attenuation. The Subic S-Band radar from Chapters 2 and 3 overlaps with the Tagaytay C-Band radar, which sets up the possibility for a three-way comparison between SR (TRMM/GPM), GR (Subic) and GR (Tagaytay), whenever all three datasets intersect in time and space. With this, we ask:
- RQ3: Can we validate the SR–GR calibration approach by comparing the consistency of two overlapping ground radars before and after bias correction? And can we interpolate the calculated biases to produce a time series of bias estimates and use it to correct historical data for periods when there are no available SR overpasses?
Chapter 4 extends the quality-weighting framework by introducing path-integrated attenuation as the basis for data quality. The calculation for PIA is done on the Tagaytay radar, a C-band radar overlapping the Subic radar. The Tagaytay radar was also found to suffer from rainfall underestimation compared to rain gauges (Crisologo et al. 2014). C-Band radars are more prone to attenuation, hence the need to consider this source of uncertainty in estimating the calibration bias. In this chapter, we also assess the ability to estimate GR calibration bias from SR overpasses by comparing the reflectivities between Subic and Tagaytay radars before and after bias correction.
1.6 Towards open science
Open source software plays a big role in this thesis. All processing steps, from reading the data to creating visualizations were done using wradlib, which was in turn built in Python. wradlib (short for weather radar library) is an open-source library for weather radar data processing. Codes in the form of Jupyter notebooks starting from Chapter 3 were published online through Github, along with sample data, to allow for a transparent view of how the results came to be, and provide a starting point for interested parties who might want to give the procedures a try. The computational procedures are also thoroughly described in the article texts as suggested by Irving (2016), which supports the steps towards reproducibility and transparency in atmospheric sciences.
References
Crisologo, I., G. Vulpiani, C. C. Abon, C. P. C. David, A. Bronstert, and Maik Heistermann. 2014. “Polarimetric Rainfall Retrieval from a C-Band Weather Radar in a Tropical Environment (the Philippines).” Asia-Pacific Journal of Atmospheric Sciences 50 (S1): 595–607. https://doi.org/10.1007/s13143-014-0049-y.
Irving, Damien. 2016. “A Minimum Standard for Publishing Computational Results in the Weather and Climate Sciences.” Bulletin of the American Meteorological Society 97 (7): 1149–58. https://doi.org/10.1175/BAMS-D-15-00010.1.
Schwaller, Mathew R., and K. Robert Morris. 2011. “A Ground Validation Network for the Global Precipitation Measurement Mission.” Journal of Atmospheric and Oceanic Technology 28 (3): 301–19. https://doi.org/10.1175/2010JTECHA1403.1.
Warren, Robert A., Alain Protat, Steven T. Siems, Hamish A. Ramsay, Valentin Louf, Michael J. Manton, and Thomas A. Kane. 2018. “Calibrating Ground-Based Radars Against TRMM and GPM.” Journal of Atmospheric and Oceanic Technology, February. https://doi.org/10.1175/JTECH-D-17-0128.1.